Confession #1. I am a super newbie in this. You can see that my graphs are ugly and my code is suboptimal. But I learned a ton about my page's engagement regardless.
The whole analysis can be found here:


And the data is here:
https://drive.google.com/file/d/1ZcP7KTVnE5NFc7bIQztjaE3tu_U3Z-6W/view?usp=sharing
Finally, before we begin. I have data from 2018 to 2022, through magazine publications, changes of FB algorithm, covid, the release of my book, gallery membership, and I keep collecting data now for post-covid time. The data is not complete, but it's how the life data is for the most part. Now let's get to it:
Lesson #1
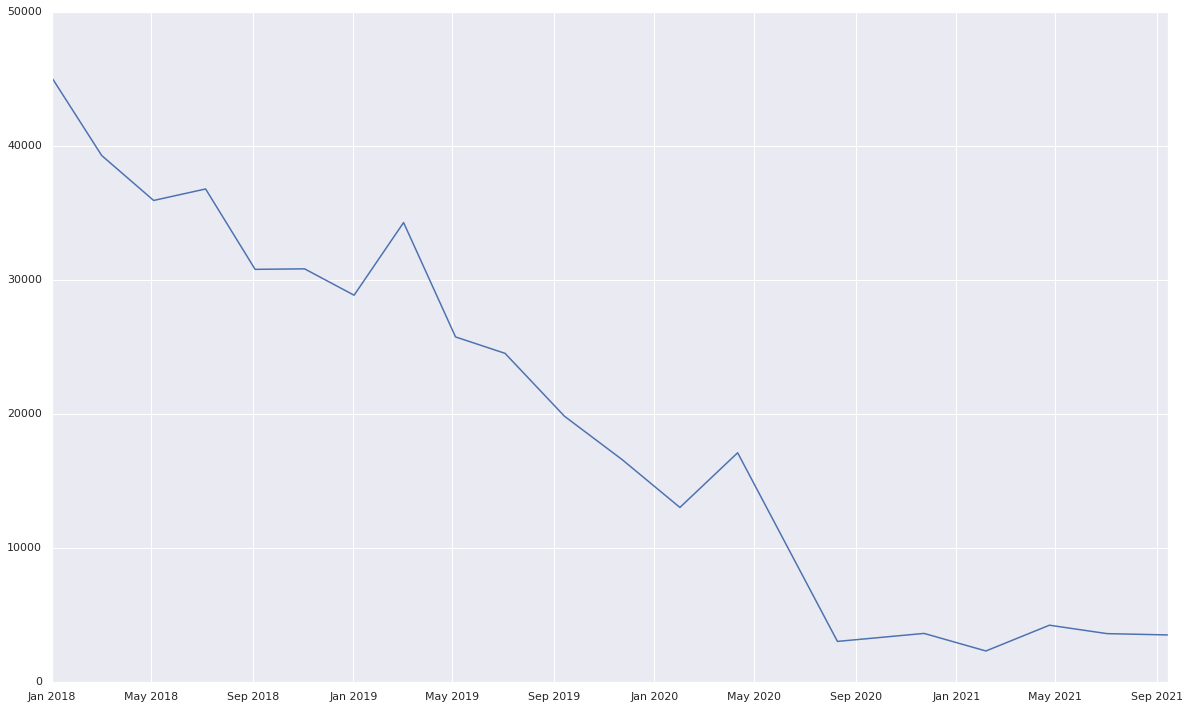
Because of the change of algorithm, the number of likes decreases over time for the same budget. But the number on loves, comments, and shared doesn't.
If you look at graph #1 for likes you will see a frightening picture: FB rates steadily go up and Fb organic engagement falls flat. The core audience doesn't leave though they continue to like, comment, and share just as much as 4 years earlier (they also talk to you, collect your stuff, and/or commission something special from time to time)
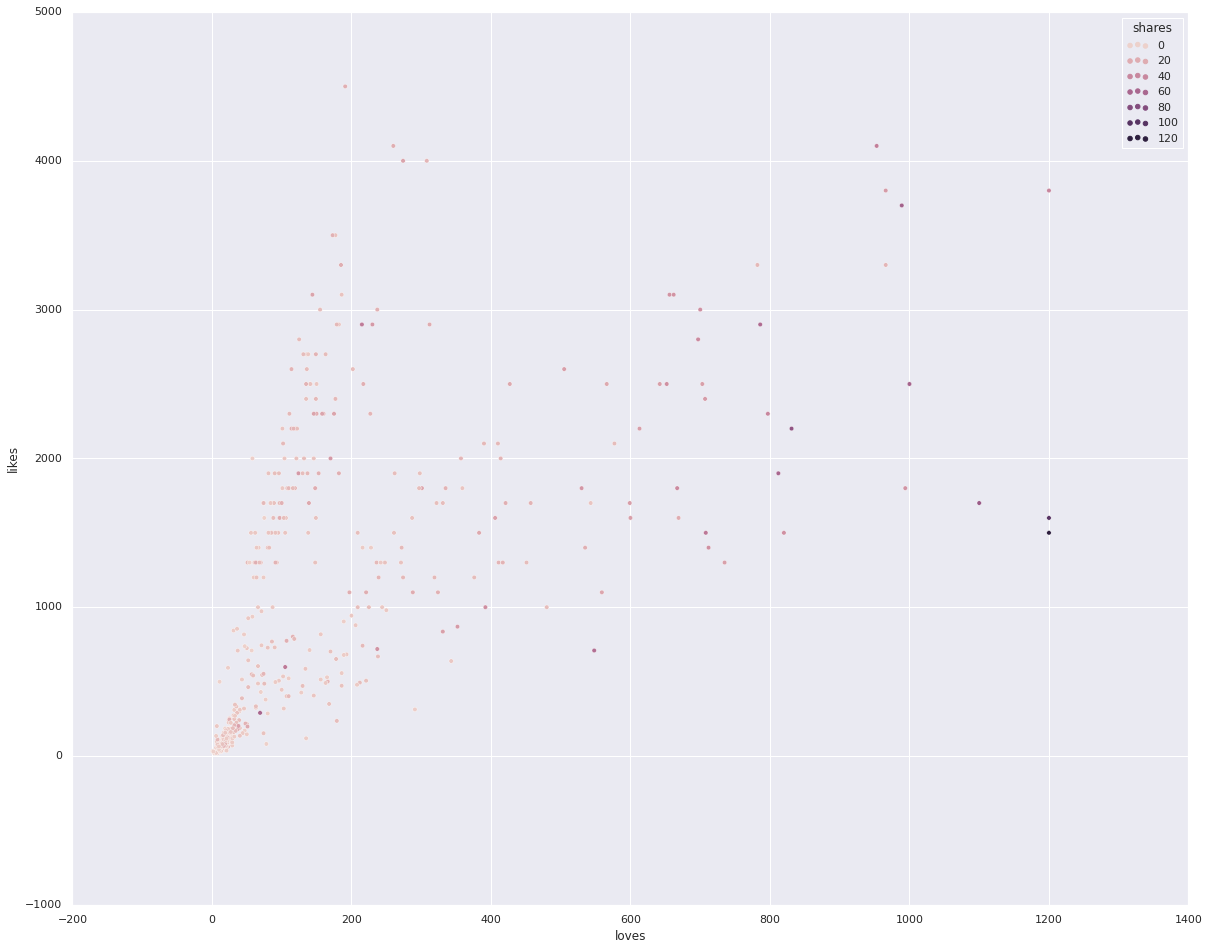
Likes:
Shares:
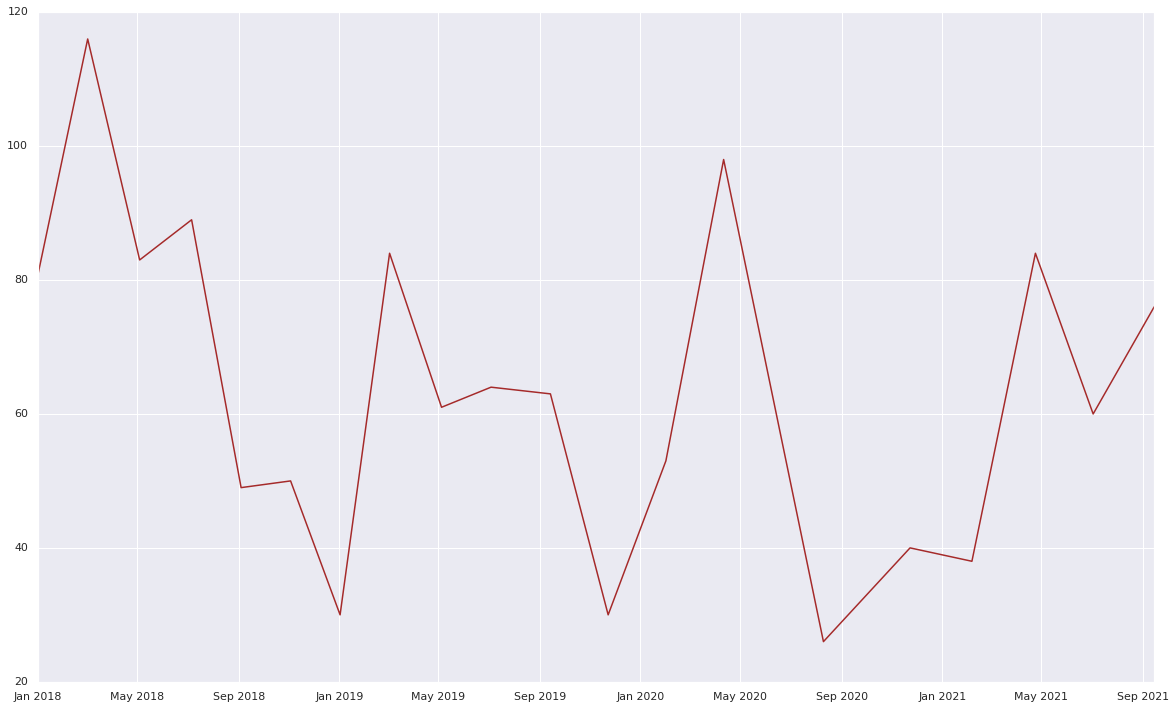
Also, people share more in Spring compared to Winter :)
Lesson#2
Haters and popularity are not correlated, it's just a story we want to tell ourselves.
Among 7 pictures with the most hate, only two had higher than average popularity.
Among 20 most popular pictures, only 2 had negative comments (one inappropriate, one that "this is old"), only 5 had one or more "sad face" reactions for thousands of likes and loves.
Lesson #3
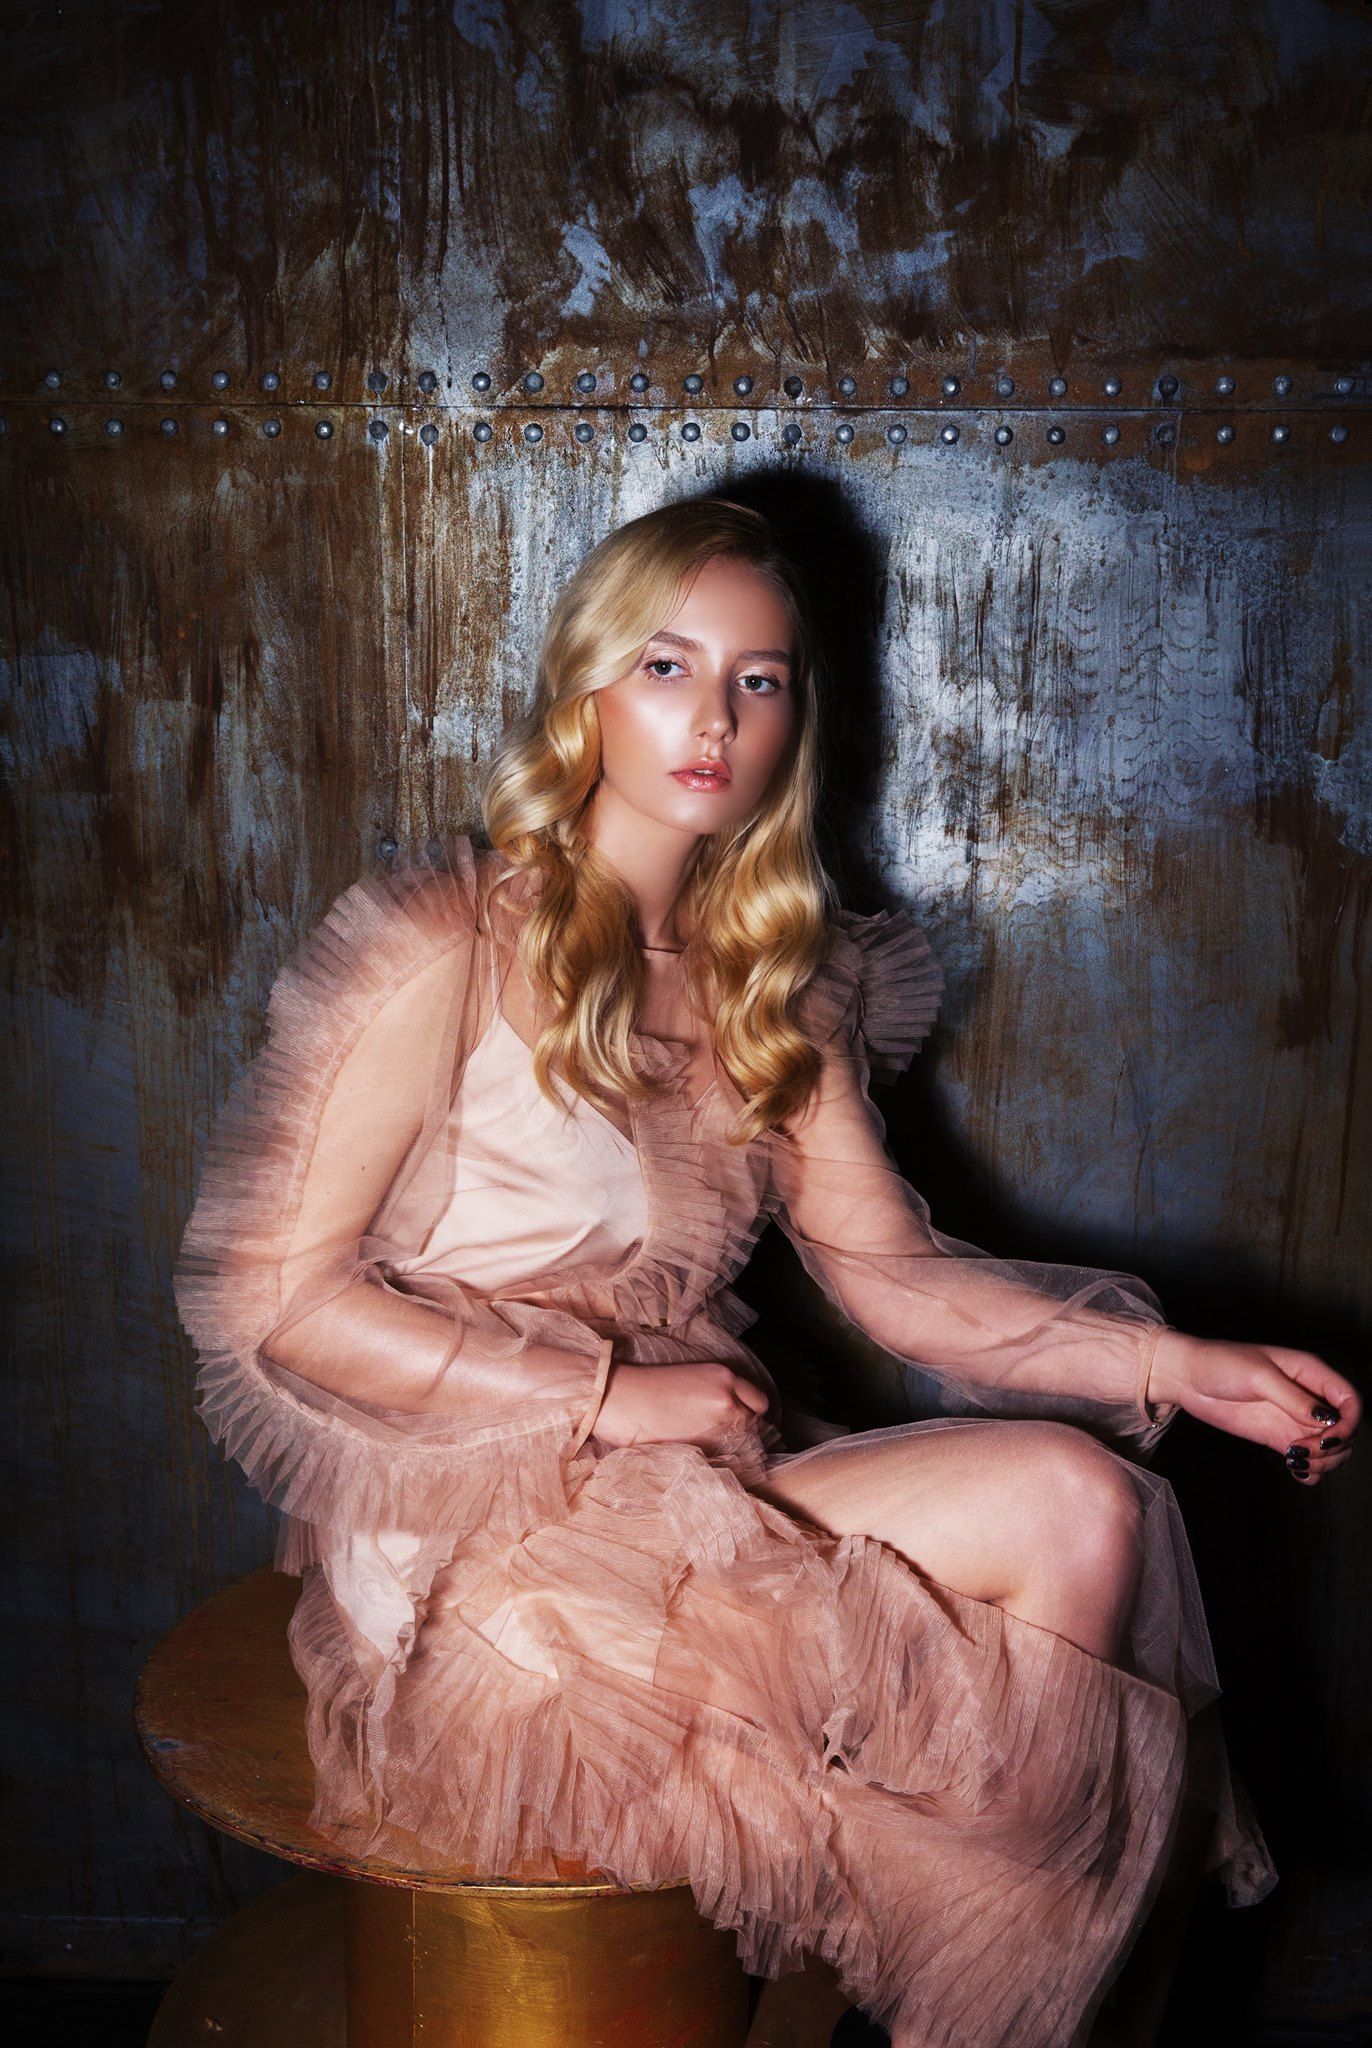
Pictures that are sensual in a warm way as well as pictures when the model is a bit more abstract figure (less portrait of a face/person) tend to get more likes and shares.
I think that I got the same lesson from my Gallery House shows - people like when they can imagine someone on model's place (as opposed to commissions, when you want to show why this given person is special).
Relevant data is in the first graph of the article:)
Lesson #4
Men are more generous with likes and feedback than women. Least generous (and most critical) are girls 13-17 y.o.
Among best of the batch (metrics that accounts for changes in cost-per-click rates): 9/20 pictures were praised more by men
3/20 by women
1/20 had an equal mix
7/20 unknown (gaps in early data)
You can see much more about the Best Of The Batch group in the main document.
Lesson #5
One of my research questions was if adding the "Learn More" button with click-through to my website reduces engagement.
After relevant analysis, I decided positively on adding the button when appropriate - not only do posts with buttons have more average likes in 2021, but the clickthrough rate is very high for a relevant audience. One caveat is, when clicked through, people will need to see the same picture or series, otherwise, they will bounce at once.
Lesson #6
The FB algorithm is changing, trends are changing. But as long as you keep your authentic voice and respect to the audience, you will have good engagement from a group of people who sincerely likes what you do. Serving this group and adding to it will be way more fulfilling and effective than broadcasting your work to the masses. Take it from 100k followers page with several years on fb:)

If you would like to see the page in question and find your own hypothesis to test, click right here:


More about the author here:
 Aliona Kuznetsova